Gaia Source Viewer
This lightweight viewer offers an at-a-glance summary of individual sources from the Gaia Data Release 3.
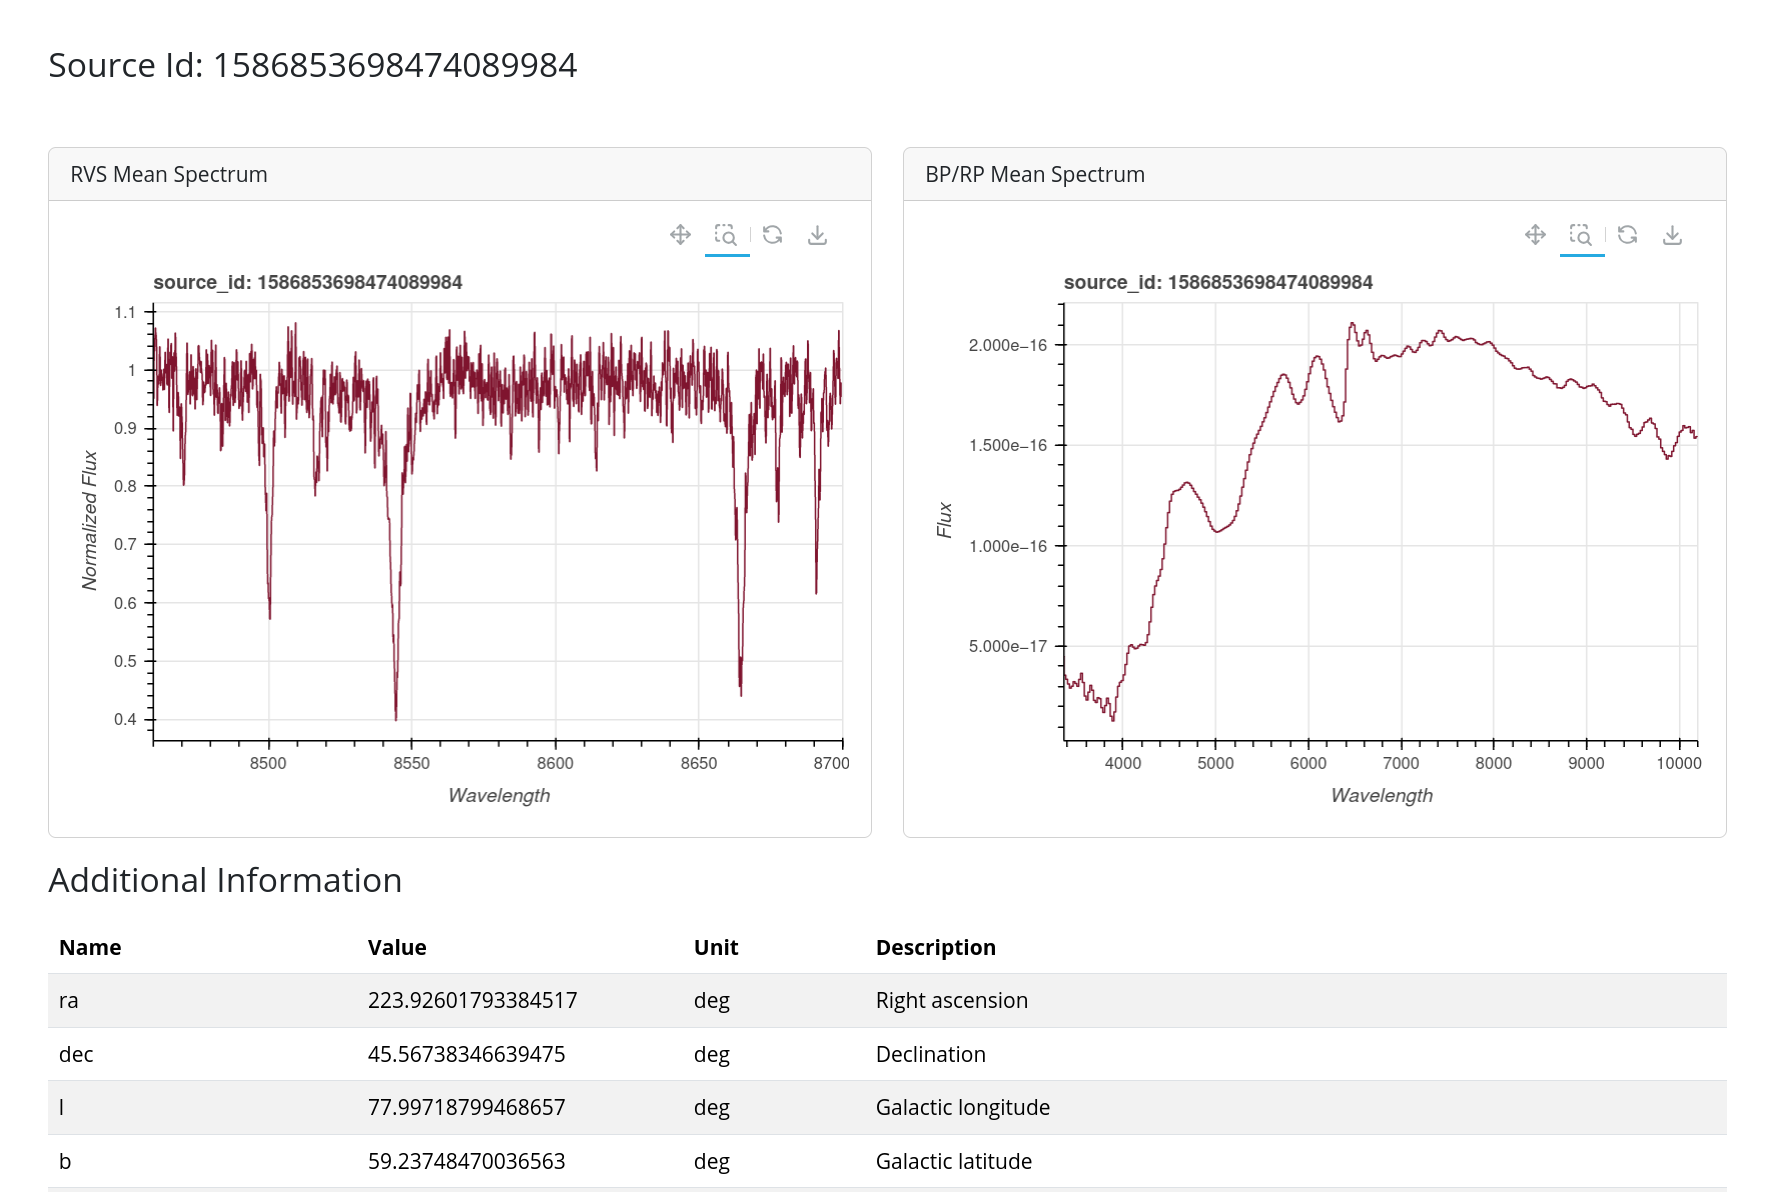
For any given source_id, it displays two interactive plots:
- the Radial Velocity Spectrometer (RVS) mean spectrum (
gaiadr3.rvs_mean_spectrum) - the BP/RP (Blue/Red Photometer) mean spectra (
gaiadr3.xp_sampled_mean_spectrum)
Users can zoom in on the plots and export them as PNG images. Additional source information is listed in a table below.
While the viewer is currently minimal by design, further functionality may be introduced in future updates. Feel free to contact us if you find any bugs or have feedback on the viewer.
Gaia Source Viewer for source_id = 1586853698474089984